|
by Tom Hanrahan SABR, The Best of By The Numbers |
|
|
|
|
INTRODUCTION
A catcher’s main job,
everyone knows, is to call a game and handle the pitching staff. Everyone may
know this, but in a game that has statistics for virtually everything, there
seems to be precious little time and energy devoted to measuring how well
catchers do their main job. Rather, we see catchers’ defense measured by how
many base stealers they throw out, and all of their other defensive skills
(“framing” the pitch, setting up the hitter, bringing along the pitcher) are
defined anecdotally by TV and radio announcers. This study is an attempt to
determine if catchers’ defensive abilities as a whole improve as they mature
and adjust to a pitching staff, and to quantify this as much as is possible. We start by asking the question “what
general factors might affect a catcher’s ability to handle a pitching staff?”.
I suggest that his ability might vary with: 1)
His age and experience 2)
His familiarity with the pitchers he is catching 3)
His familiarity with the batters his pitcher is facing There may be other specific factors like special
tutoring under a specific coach, but these kinds of things will not help us
answer the question in general. Tests could be set up to measure any one of
these. My focus in this study was to see if catchers’ defense improved in the
whole, as they became familiar with a pitching staff. At the end of this paper,
I will look at how the findings here might be dissected into the individual
factors. THE STUDY
How
do we best measure a catcher’s defensive abilities? I propose the only
reasonable answer is the ERA of the team for which he is catching. How could we
best isolate the catchers’ defensive ability from all of the other factors that
cause a team ERA to rise or fall? I attempted to do this by using all of the
teams that had the same primary catcher in consecutive seasons. I
defined “primary” as having caught at least 85 games during a season. I used
the years 1946-1987; beginning after the players returned from WWII, and going
through the last year in my Baseball Encyclopedia. No adjustments were made for
strike years or change in length of the season. I did not use years when a team
changed cities ( There were 104 catchers used
in the study. The total number of catcher years was 539, representing about
60,000 total games caught. This gave me a large set of matched pairs of teams
in consecutive years using the same catcher. I found the team ERA for each
year, and compared it to the league average. I also recorded the number of
games the team’s catcher had caught in his career prior to the start of the
season. Obviously there was always some movement of pitchers between years,
some hurlers improving or declining, changes in the team defense at other
positions, and changes in ballpark dimensions. But if I could get a large
enough sample that all of these other factors got washed out in the noise, I
would be able to see if the number of games caught by the catcher was an
important contributor to the team ERA. As
an example, I will use Bob Boone’s career. He caught at least 85 games every
year except the strike year of 1981. Table 1. Bob Boone's Career
In
Boone’s rookie year, having only caught 14 games prior to 1973, the team ERA
was .33 runs per game higher than the league average. In his second season,
this improved slightly to .30 higher than the league average; just .03 runs per
game better. Continued improvement was shown in the next two years, after which
there was a meandering slow drop off until he retired. We have 7 pairs of years
while he was with the Phillies (73-73, 74-75…. 79-80), and 5 pairs of years
with the Angels. Even if he had caught full time in 1981, the pair of years
80-81 would not be used in the study because he switched teams (and pitching
staffs). ORGANIZING THE DATA I
built two groups of data. In the first, I grouped the year-pairs in bins of
hundreds of career games caught: 0-99, 100-199, etc. I only used those pairs of
consecutive years where the catcher’s games crossed from one grouping to the
next. Thus, we can use Boone’s 73-74, but not 77-78, because he crossed right
through the 500’s. This grouping was used to focus on changes from one year to
the next, so I could build a function over time. Controlling the number of
games caught (by 100’s) allowed me to use that as the variable that could link
one group to the next. There were 306 matched year-pairs using this method. I
think this method gives a good deal of organization to the data (it’s easy to
use and see the trends), but I did lose a few of the samples. Secondly, I compared rookies
to veterans directly by comparing years that were somewhat further apart. In
the next grouping, I again organized the data into bins of hundreds, but this
time I compared them not to the previous year, but to their record 3 years ago,
having caught for the same team for 4 consecutive years. I did not control how
many career games the catcher had 3 seasons prior. Going back to the Boone
example, between 1973 and 1976 the Phillies’ ERA improved relative to the
league by .73 runs per game (from .33 to -.40). So, I recorded one data point
for a catcher with career games caught in the 300s, a team ERA of -.73 compared
to 3 years ago. This second grouping contained fewer points, because not as
many catchers started at least 85 games for the same team for this length of
time. I chose 3 years as the comparison point because a)
the more years apart, the
less data there are, so using a longer time span would be difficult, and b)
the results of the first
data grouping suggested that a 3-year span would show noticeable differences. After trying this 3-year
comparison, I wound up focusing exclusively on comparing raw rookies to
veterans, since this is where the most obvious differences appeared. COMPARING CONSECUTIVE SEASONS (GROUPING ONE) I
found 49 consecutive year-pairs where the catcher’s career games caught went
from between 0-99 to between 100-199. The average team had an ERA of .07 runs
per game lower when the catchers had the extra year (= 100 games) of
experience. Table 2 shows the data from every bin. As the amount of data became
small for catchers with over 1000 games, I combined the last groups to ensure
my sample sizes were at least 15. Table 2
The
data in Table 2 strongly suggest that the defensive ability of the catchers
improves steadily until they have caught somewhere between 400 and 800 games
with the same club. The team ERA drops about three tenths of a run per game
from the time they have their first full season until they reach this level of
maturity. After this there is a slow rise in the team ERA until the catcher
retires.
Chart 1. Cumulative ERA Differences by Catcher Experience
COMPARISONS OVER 3 YEARS (Grouping Two) Table 3 shows the catcher year-pairs organized by bins of hundreds in a different manner. The 279-300s row shows that there were 14 catchers we could use to compare the team ERA between the year when they had between 279-399 games caught under their belts, to the team ERA 3 years prior to that. The average number of games caught in each career 3 years prior is shown. The first row indicates that after 3 years, the team ERA averaged .28 runs per game lower. It also shows that of the 14 teams represented, that 12 of the 14 had a lower team ERA (relative to the league average) when the catcher was a veteran of 279-399 games, as compared to 3 years prior when he had only caught an average of 27 games in his career. Table 3
* 279 was
the minimum number of career games caught for any catcher who also was a
starting catcher 3 years ago. The
data in Table 3 is pretty much in agreement with that in Table 2; significant
improvement in team ERA the first few years, and a slow decrease in performance
toward the catcher’s later years. The item that jumped right out at me was the
first 2 rows of the right hand column. Out of 38 teams, 32 of them had ERAs
that were lower with the catchers who had an extra 3 years of experience. With
all of the changes that likely occurred in the team pitching staffs and other
defensive changes over the years, this strikes me as remarkable that about 85%
of the teams would improve their pitching. As
I studied the 38 catcher seasons involved in the first 2 rows, I noticed that
the trend was even stronger when using just the catchers who had virtually no
previous major league experience. So, I organized the data one last time, using
ONLY the catchers who had VERY little experience (fewer than 50 games)
prior to their first full-time year, and making comparison to their “prime”
years. Table 2 shows that the catchers’ prime seemed to be when he had previously
caught between 400 and 799 games (this is where the cumulative ERA was the
lowest). I found all catchers who a)
caught at least 85 games in a season, having had 50 or fewer career
games coming into that year, AND b)
caught at least 85 games in other seasons, with the same team, having
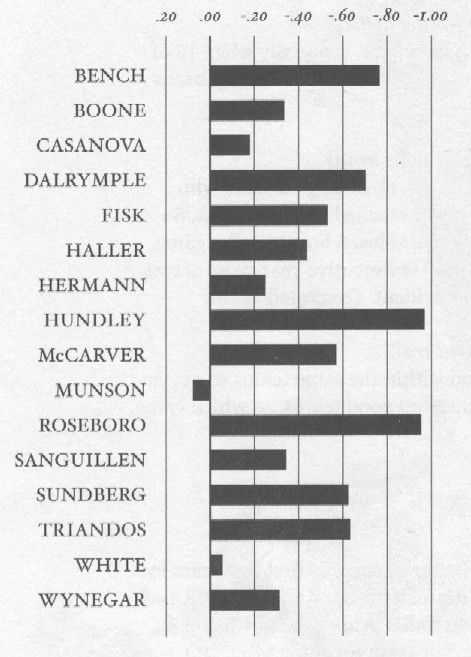
between 400 and 799 career games caught before these other seasons. There were 16 comparisons. The teams, “rookie” years, and catchers used were:
I
recorded the team ERA (relative to the league) in the rookie year, and the
average team ERA of all years used in the “prime veteran” classification. Of
the 16 teams, only ONE had their ERA get worse when the catcher went from
rookie to veteran status; fifteen teams had better ERAs with the veteran
catchers. The average improvement was .47 runs per game, or 76 runs over a 162
games season! This is very likely a larger difference than importing Ozzie
Smith, Willie Mays or Bill Mazeroski in their primes to help your defense. It’s
even more remarkable when you consider that the ERA comparisons are for the
whole season, including the games these catchers did NOT start. Many of these
catchers caught three fourths or less of their team’s games, so the improvement
per game caught might be 30%-40% more! The data for these 16 teams and catchers
are graphed in chart 2. Chart 2
I went back and checked to see what each of these 16 teams’ ERA was in the year PRIOR to these catchers being rookies, just to make sure that what I was seeing here wasn’t some strange effect, such as a group of all-world defensive catchers (there WERE some mighty fine names in this bunch) helping their teams tremendously while they were in their peak years. These teams had their ERA go UP relative to the league an average of .22 runs per game in the year that they were full time rookies (the years given above in the list). In other words, in their first year, these catchers appeared to hurt their team defensively by a fifth to a quarter of a run per game. Then, over the next 3 to 7 years, their defensive skills improved enough to help their team ERA to go down by almost half a run per game, so there was some net improvement comparing their prime years to the year before they showed up. One
of the teams in this study was the ‘58 Dodgers, who moved into a vastly better
pitchers’ park in 1962, so we shouldn’t be surprised that the team ERA improved
so much with Roseboro catching as he became a veteran. Still, tossing out one
data point won’t make that much difference. OBJECTIONS – Let’s play devil’s advocate. 1.
Maybe this sample is too small and we’re seeing some random chance
effects. Overruled. Already covered this; there’s too much data here. When 15 of the 16 teams improve over time…well, if you flip 16 coins, 15 of them will come up heads less than 1 time in 3,800. 2. What
if the catchers represented an anomalous group of some kind? In
the second grouping (comparisons over 3 years), obviously catchers who washed
out of the majors didn’t factor in, since they never reached veteran status. So
one could argue that maybe these were the catchers who DID learn how to call a
game, and the others did not. But, in the first grouping, we used consecutive
year-pairs across every level of games caught, and the same pattern was
evident. Overruled again. 3. Park
factors? Moving over time to a pitching-dominated era? Great hurlers flocking
to these teams for a chance to pitch to these guys? A disproportionate amount
of good teams and/or catchers in the sample? We
compared everything relative to the league and within the same teams, to get
rid of park and trend effects. These guys were good catchers on good
teams…which came first, the chicken or the egg? CONCLUSIONSIf you have a veteran
catcher who has been with your team for some time, and you’re thinking of
trading him and calling up the young phenom from AAA, you can expect your
pitching results to get worse. Of course, you ought to call him up SOMETIME,
but don’t expect the team to improve right away. How many catchers are
offensively 50 runs a year better than their replacement? (Piazza begins and
ends the short list) The differences in catchers’ stolen bases allowed are apparently LESS important than his other defensive abilities. The worst throwing catchers in the majors do not allow anywhere near one stolen base per game more than Ivan Rodriguez does. FINALE I f differences this large show up comparing CLASSES of catchers, does this not infer that there might also be large differences between INDIVIDUAL catchers? This study suggests that the measuring of catchers’ defensive contributions may be the single most important yet unanalyzed ingredient of determining team success in the game today.
This article originally appeared in the August 1999 issue of By The Numbers. |
||||||||||||||||||||||||||||||||||||||||||||||||||||||||||||||||||||||||||||||||||||||||||||||||||||||||||||||||||||||||||||||||||||||||||||||||||||||||||||||||||||||||||||||||||||||||||||||||||||||||||||||||||||||||||||||||||||||||||||||||