Able to zip the ball on a line to any
base from his knees, Santiago has the deadliest
throwing arm among active ML catchers, but he has struggled offensively after a sensational
rookie season, and his all-around defensive play remains sloppy. He was a unanimous
choice as NL Rookie of the Year in 1987, when he hit .300 with 18 HR, 79 RBI, and
21 stolen bases, threw out 33% of the opposition's base stealers, and set a ML rookie
record with a 34-game hitting streak (finally broken by Orel Hershiser). The streak
was also a club record, and a ML record for catchers. Santiago's throwing improved
in 1988, as he began to show off his lightning-quick from-the-knees throw more regularly.
He threw out 45% of the base stealers who dared run against him, and picked off nine
runners - seven at second base. His hitting, however, slumped badly (.248, 10 HR,
46 RBI), and although he won a Gold Glove, he still led NL catchers in errors for
the second consecutive season with 12.
Biography
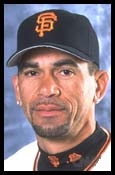
It's hard to believe that Benito has played for six different teams since winning the National League Rookie of the Year
Award in 1987 with the San Diego Padres. In recent seasons he's done more traveling than Rand McNally. After stops with the
Florida Marlins (1993-94), Cincinnati Reds (1995), Philadelphia Phillies (1996), Toronto Blue Jays (1997-98), Chicago Cubs
(1999) and Cincinnati again (2000), he hooked up with the Giants in 2001 and was most impressive in the early going.
Benito hit .318 in April and .319 in May as he batted anywhere from fifth to eighth in the lineup. He went on to appear in
133 games -- his most since 1996 -- and hit .262, with six homers, 25 doubles and 45 RBI.
Benito has always been a good
fastball hitter, but it was his cannon-like arm that garnered much of the attention during the early part of his career.
Able to throw out runners from his knees, he nailed 35 of the 101 runners who tried to steal on him in 2001. Benito still
holds major-league records for the longest hitting streak ever recorded by a catcher and a rookie. His streak of 34 games to
close out the 1987 season was tied for the eighth longest in big-league history when 2002 began.
Transactions
- September 1, 1982: Signed by the
San
Diego Padres as an amateur free agent.
- October 26, 1992: Granted Free
Agency.
- December 16, 1992: Signed as a
Free Agent with the
Florida Marlins.
- October 20, 1994: Granted Free
Agency.
- April 17, 1995: Signed as a Free
Agent with the
Cincinnati Reds.
- October 31, 1995: Granted Free
Agency.
- January 30, 1996: Signed as a Free
Agent with the
Philadelphia Phillies.
- November 18, 1996: Granted Free
Agency.
- December 9, 1996: Signed as a Free
Agent with the
Toronto Blue Jays.
- October 23, 1998: Granted Free
Agency.
- December 9, 1998: Signed as a Free
Agent with the
Chicago Cubs.
- October 28, 1999: Granted Free
Agency.
- February 24, 2000: Signed as a
Free Agent with the
Cincinnati Reds.
- November 3, 2000: Granted Free
Agency.
- March 17, 2001: Signed as a Free
Agent with the
San
Francisco Giants.
- November 7, 2001: Granted Free
Agency.
- December 7, 2001: Signed as a Free
Agent with the
San
Francisco Giants.
- October 26, 2003: Granted Free
Agency.
- December 11, 2003: Signed as a
Free Agent with the
Kansas City Royals.
- December 16, 2004: Traded by the
Kansas City Royals with cash to the
Pittsburgh Pirates for
Leo Nunez.
- May 8, 2005: Released by the
Pittsburgh Pirates.
- June 22, 2005: Signed as a Free
Agent with the
New
York Mets.
- July 18, 2005: Released by the
New
York Mets.
The transaction information used here was obtained free of charge
from and is copyrighted by
RetroSheet. We attempt to update transactions throughout the
season.
Salaries
| Year |
Age |
Team |
Salary |
Sources |
Notes |
| 1987 |
22 |
San Diego Padres |
$63,500 |
1987 USA Today survey |
|
| 1988 |
23 |
San Diego Padres |
$167,500 |
USA Today, 4/1/88 |
|
| 1989 |
24 |
San Diego Padres |
$345,000 |
1991 TSN Guide 28; T. Timmerman database |
1989 USA Today survey $336,000 |
| 1990 |
25 |
San Diego Padres |
$750,000* |
|
|
| 1991 |
26 |
San Diego Padres |
$1,650,000 |
3/4/91 TSN |
Arbitration loss; $2,500,000 request |
| 1992 |
27 |
San Diego Padres |
$3,300,000 |
4/2/92 USA Today |
Arbitration win; $2,500,000 offer |
| 1993 |
28 |
Florida Marlins |
$3,400,000 |
1996 Joint Exhibit 1 |
|
| 1994 |
29 |
Florida Marlins |
$3,800,000 |
1996 Joint Exhibit 1 |
|
| 1995 |
30 |
Cincinnati Reds |
$650,000 |
1996 Joint Exhibit 1 |
Includes $100,000 earned bonus |
| 1996 |
31 |
Philadelphia Phillies |
$1,700,000 |
1997 Joint Exhibit 1 |
Includes $600,000 earned bonus |
| 1997 |
32 |
Toronto Blue Jays |
$2,500,000 |
1997 AP survey |
|
| 1998 |
33 |
Toronto Blue Jays |
$4,000,000 |
4/3/98 USA Today |
|
| 1999 |
34 |
Chicago Cubs |
$1,700,000 |
11/19/99 USA Today |
Includes $200,000 earned bonus |
| 2000 |
35 |
Cincinnati Reds |
$650,000 |
4/5/00 AP |
|
| 2001 |
36 |
San Francisco Giants |
$500,000 |
4/6/01 USA Today |
|
| 2002 |
37 |
San Francisco Giants |
$2,044,168 |
4/3/02 AP |
|
| 2003 |
38 |
San Francisco Giants |
$1,775,000 |
4/3/03 AP |
|
| 2004 |
39 |
Kansas City Royals |
$2,150,000 |
4/7/04 AP |
|
| 2005 |
40 |
Pittsburgh Pirates |
$2,150,000 |
|
|
|
|
|
| Career to date
(may be incomplete) |
$33,295,168 |
|
|
Disputed Salaries
*1990 - $1,250,000 - 11/21/90 NYT - Arbitration win; $750,000 offer
Salary Data (
about)
courtesy Doug Pappas, and the
Society
for American Baseball Research.
Salaries for mid-season call-ups or traded players may not be shown.