Connecticut Demographics
Connecticut:
The Constitution State Atlas ![]()
Connecticut
Demographics ![]()
Population Pyramids for Connecticut and Counties
| Fairfield | New Haven |
| Hartford | New London |
| Litchfield | Tolland |
| Middlesex | Windham |
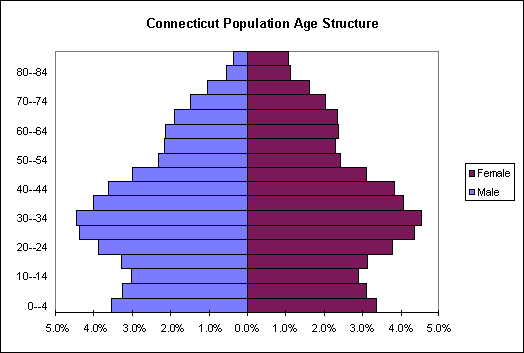
The population pyramid is used by geographers as a graphical representation of a population's age and sex structure. The construction of a pyramid is very simple. Census data is gathered for a given population, it is broken down into eighteen age groups split by sex. The age groups are made up of 5 year intervals, 0 - 4 is the first group, 5 -9 is the second, and the last is 85 and up. Once all the totals are tallied for each group, they are converted into percentages based on the total. For instance if there are 3 females aged 50-54, and the total population count is 100, this age-sex group would represent 3% of the total. When these values are calculated, construction of the graph is ready. The x axis represents total percentage, from the center to the left is the male population, and from the center to the right is the female population. The y axis represents the age groups. Each age group is stacked starting at the bottom with the 0 - 4 year olds, and ending at the top with the 85 and up age group.
The name "population pyramid" is given to this type of graph, because for a normal healthy population one would find a large base decreasing as age increases. The result would be a nicely shaped pyramid, with each sex making up half the population for each age group.
The population pyramid reveals many characteristics about a given population. If the base is very heavy, then more schools may need to be built to handle a large influx of students. If the middle and top are large then more old age facilities will be needed. Where tax dollars are coming from is also a telling tale of the population pyramid. Who is the working class?
From the pyramid shown below of Connecticut's total population, a large middle section is revealed. A pyramid has been constructed for each county, links are provided in the tables at the top and bottom of this page. This large middle section can be seen in each of Connecticut's counties, and for the United States as a whole. It represents the baby boomers. This group was born into a booming economy following World War II, and currently makes up most of the working class. The working class is the portion of a population financially caring for the young and old.
This large middle section also represents a great problem. Since the numbers of the dependent population are smaller they will have a harder time supporting the boomers retiring. Taxes are likely rise for the younger generation. The younger generation will also have less representation, as to where their tax money is spent.
| Fairfield | New Haven |
| Hartford | New London |
| Litchfield | Tolland |
| Middlesex | Windham |
Connecticut
Demographics ![]()