GIS APPLICATION IN PERMACULTURE
PREAMBLE
GIS or Geographic Information System is a computerised means of managing spatial information. Its application is diverse and can be applied to virtually any field of business or science.
In permaculture, GIS can be applied in a number of ways, and every page I turned in Mollison's book the more uses I see for GIS. A preliminary list would include things such as patterning, yield and function, water management, resource databases, environmental management, keyline constructs, the earth shaping, resource management, etc., etc.
"But", I hear some people say " you are talking about a high-technology application/tool, something that has no place in permaculture". However, regardless of the negative connotations of computing power, I would argue that it is the most efficient system developed to date, for storing and managing large volumes of information. At a rough calculation an average page of text takes up about 4 KB, which means I can store about five million pages on my computer. How many trees is that? At the same time I can copy, modify and recombine all this data without the need of reproducing the information on paper. A computer also works much faster and can perform functions in a day that would take us a month manually. This also makes it very time and energy efficient.
I do not however recommend that permaculturalists get themselves a GIS system. It would be a nice to have, not a need to have. However, in the field of permaculture design this can be an invaluable tool, as I hope to demonstrate.
Due to the diverse and inexhaustible nature of the subject matter, I will briefly touch on certain aspects of GIS in permaculture, in fact, I am not sure if a book would even do the subject justice. At the same time I want you to bare in mind that this is a conceptual discussion at this point, and I have not attempted to be permaculturally correct, but concentrated more on the potential application it has in this field.
BACKGROUND
For me, the resource and yield diversity of permaculture applied to homestead farms in a traditional rural setting will be key success factors for its implementation. Coupled to this are the spatial patterns that assist in resource management and yield.
Immediately a number of problems come to the fore. Firstly, permaculture has not been applied to any great degree in these areas, so we have no idea what an optimal pattern should look like for any given area. Yes, we can fall back on standard texts and site specific examples from other areas for guidelines, but these may not be optimal. Secondly, we are dealing with a culture where the staple diet is maize, minor greens and meat. Diverse food production is not a tradition here. Which leads to a third problem, because diversity has been small the best growing conditions and/or crop types are largely unknown. Again documentation can give guidelines, but the test is in the eating and until a baseline yield is achieved it remains theoretical. Fourthly, in this weigh it, measure it, touch it society we live in hard facts and figures is what will sell permaculture to the funding agencies.
One of the first steps will have to be a means by which we can gather and record this kind of information, building a historical site database of inputs, actions and activities, patterns and yields over time, which can then be used for site optimisation guidance. What Willem and I envisage is a permaculture demonstration/education centre which will serve the obvious function of training, but that will also be the hub from which a network of permaculture homesteads develop. If we are to provide guidance to our aspirant permaculturalists we may soon find ourselves in position of being inundated by the number of sites that develop. At the same time it provides us a unique opportunity of building up a store information that in turn can be used for optimisation.
WHAT IS GIS?
A geographic information system, or GIS, it is a digital means of visually displaying spatial mapping information and attaching a database to each map feature so that it has intelligence. Map information is stored in one of three ways, namely as area features (farm, house), line features (road, power lines) or point features (well, lamp post). As an example, cadastral boundaries on a hard copy map are drawn as connected polygons. The farm name may be printed on the map but that is the only information available. Information such as who the owner is, the size of the property, its zoning classification etc. is not directly available to the user. The GIS allows us to combine these two sets of information.
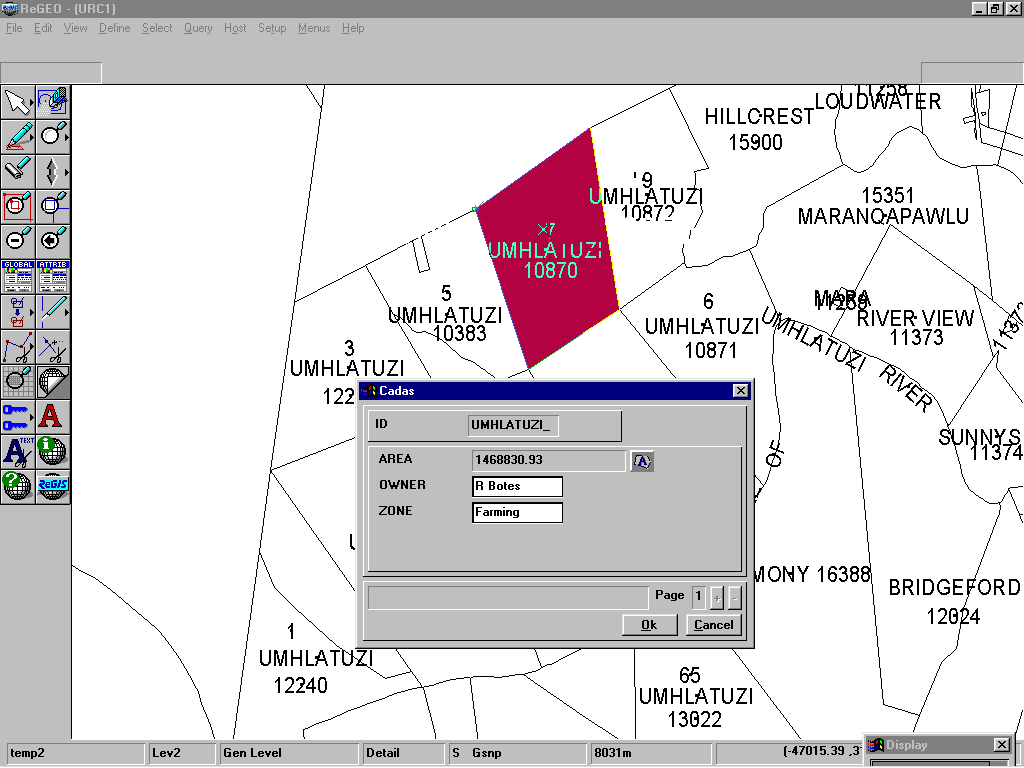
Two of the most powerful functions of the GIS are the ability to ask it questions such as where? And what? Fig 1 shows an example of farm boundaries with the red highlighted farm asked what? The associated database displays available information on the property.
Fig 1
At the same time, the databases can be populated with just about any kind of information that can then be used to make a variety of derivative maps. For instance I can ask the GIS to highlight all farms that are larger than a given size, are bounded by a river and within 10 km of a town. The GIS will then search the databases for properties that match the criteria and highlight them on the computer map.
Any information system is only as good as the data that has been captured. So at the present time, potential applications I have listed above are a futuristic wish list until such time as the relevant data have been acquired. The first step in the process.
APPLICATION
Let us assume that there is a permaculture community called Nowhere. It consists of 98 farms, and in the general area the following characteristics apply:
Crop types - 4 predominant crops are grown in the area. Each site grows only one crop.
Soil type - there are 4 main soils and each site is categorised according to the predominant soil type.
Rainfall - the average rainfall each site received during the growing season.
Irrigation water - the amount of irrigation water used during the growing season.
Also recorded is the percentage crop yield above the area baseline and manhours applied. Table 1 is a sample of the information recorded in the database.
Table 1
ID |
AREA SQR km |
WATER |
YIELD |
CROP |
SOIL |
RAIN |
MANHOURS |
| FARM1 | 10.52 |
900 |
14.8 |
1 |
1 |
700 |
200 |
| FARM10 | 7.07 |
800 |
14.4 |
2 |
2 |
800 |
210 |
| FARM11 | 10.65 |
1100 |
2.2 |
3 |
2 |
800 |
220 |
| FARM12 | 9.15 |
1000 |
3.6 |
4 |
2 |
800 |
230 |
| FARM13 | 8.81 |
1200 |
18.2 |
4 |
4 |
800 |
240 |
| FARM14 | 3.86 |
800 |
1.4 |
3 |
2 |
800 |
250 |
| FARM15 | 3.32 |
900 |
5.3 |
2 |
2 |
800 |
260 |
| FARM16 | 4.62 |
1000 |
20.2 |
1 |
2 |
800 |
270 |
| FARM17 | 9.73 |
1100 |
1.4 |
1 |
2 |
800 |
280 |
| FARM18 | 12.30 |
1200 |
5.5 |
4 |
4 |
800 |
290 |
| FARM19 | 15.86 |
1200 |
18.2 |
3 |
4 |
800 |
300 |
| FARM2 | 4.01 |
1100 |
8.3 |
2 |
1 |
700 |
200 |
| FARM20 | 4.74 |
1000 |
5.7 |
3 |
2 |
700 |
240 |
| FARM21 | 7.47 |
900 |
7.3 |
1 |
2 |
700 |
270 |
| FARM22 | 13.10 |
800 |
6.9 |
2 |
2 |
600 |
220 |
| FARM23 | 4.27 |
1000 |
7.4 |
4 |
2 |
600 |
210 |
| FARM24 | 3.38 |
900 |
8.3 |
1 |
2 |
600 |
260 |
| FARM25 | 1.47 |
1100 |
8.8 |
3 |
2 |
600 |
290 |
| FARM26 | 11.58 |
800 |
10.6 |
4 |
1 |
600 |
280 |
| FARM27 | 1.84 |
1200 |
6.0 |
2 |
2 |
600 |
230 |
| FARM28 | 4.11 |
900 |
10.5 |
4 |
1 |
600 |
300 |
| FARM29 | 8.54 |
800 |
17.1 |
3 |
1 |
600 |
250 |
| FARM3 | 5.34 |
1100 |
7.3 |
2 |
1 |
700 |
210 |
As useful as this information is, making sense of it and easily recognising patterns is tedious. In Fig 2 GIS was used to shade sites of the same crop type, rainfall, soils and irrigated water.
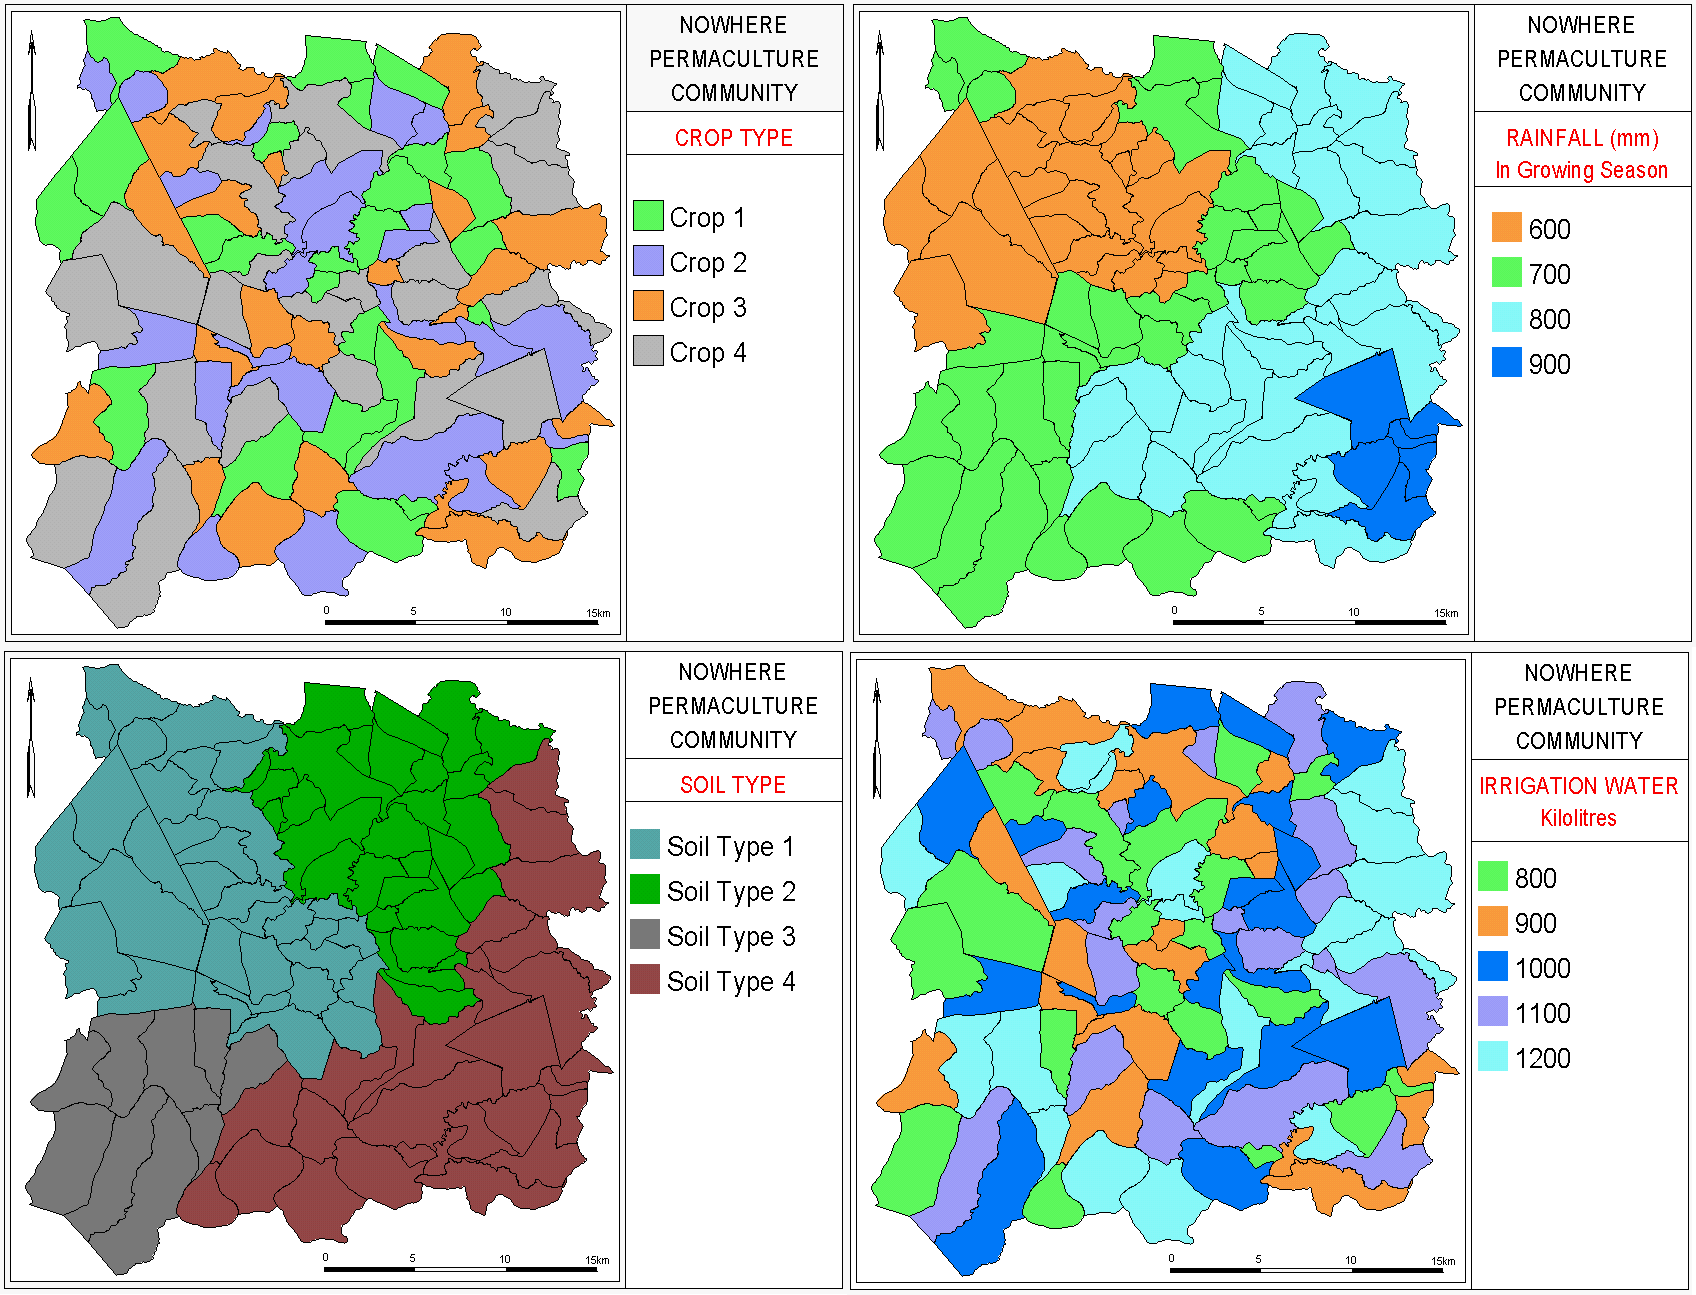
Fig 2
This is just one example of how measured values can be used to look at spatial patterns. These patterns can also be combined to extract more specific information. It may be useful to find out what the relationship is between irrigated water and yield. For example, which areas produce a certain crop, a yield > X and what the water usage was to produce this yield. As you can imagine it will be a laborious process to sift through the data to find the answer. The GIS was asked to look at sites producing Crop 4 with a yield of 15% of baseline and then to shade the amount of irrigation water used. The results are shown in Fig 3.
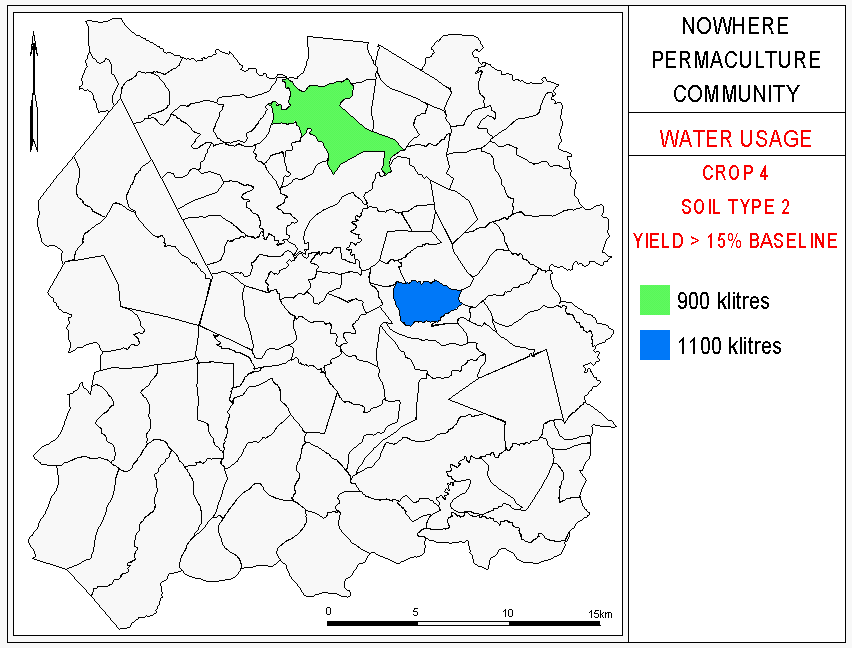
Fig 3
In this example, 2 sites meet the criteria. One used 900 kilolitres and the other 1100 kilolitres. Table 2 lists the database information for these 2 sites. As can be seen Farm 7 produced a higher yield with less water and manpower.
Table 2
ID |
AREA |
WATER |
YIELD |
CROP |
SOIL |
RAIN |
MANHOURS |
| FARM7 | 15.74 |
900 |
21.40 |
4 |
2 |
700 |
200 |
| FARM71 | 6.75 |
1100 |
16.70 |
4 |
2 |
700 |
220 |
DISCUSSION
If the example above were a real-life case it would be well worthwhile to find out what is being done differently. One would like to establish the circumstances that produced such a yield to determine if it meets permacultural principles and if it can be applied to other similar sites to produce the same yield. In other words optimal growing conditions for Crop 4.
As stated above, the aim is to produce more with less resources and effort. And the best way of doing that is to have a good record from which we can learn and then apply to other areas.
Using a single site, actions taken over timeframes can be mapped. Yearly information can be compared, graphed and evaluated to see if changes were successful.
LOCAL SITE APPLICATION
Below is an example of a local site (Fig 4).
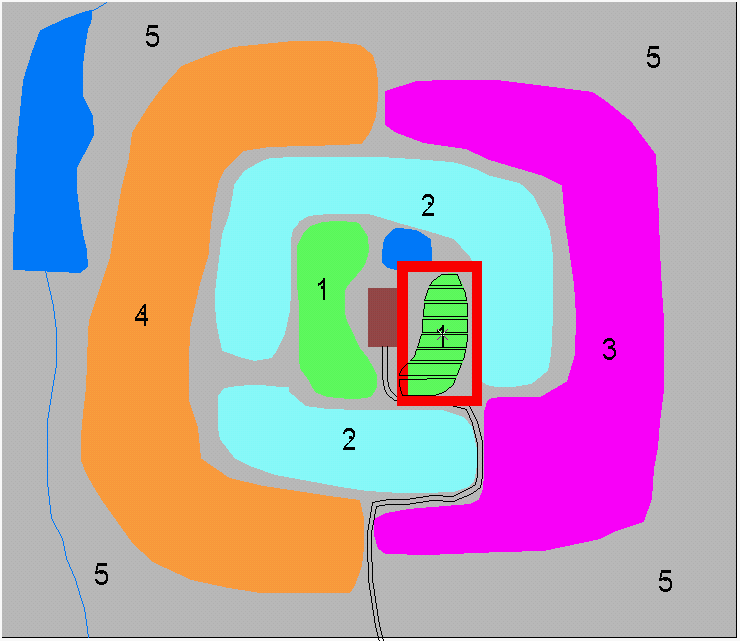
Fig 4
The numbers pertain to the zones. For this discussion the Zone 1 area highlighted by the red box will be concentrated on.
This is again a theoretical scenario very broadly based on some info I got from Dan’s article in TIPS (Vol 1, No3, 1994) on Basics of Soil Health.
For this example I have assumed the following:
What I want to monitor is what kind of soil preparation or tillage method combined with 2 different water sources will give me the best yield. I have laid out 8 garden beds and used 5 different types of tillage. In Fig. 5 I have shown the distribution of the 2 main factors, tillage and water and what yields were achieved from this.
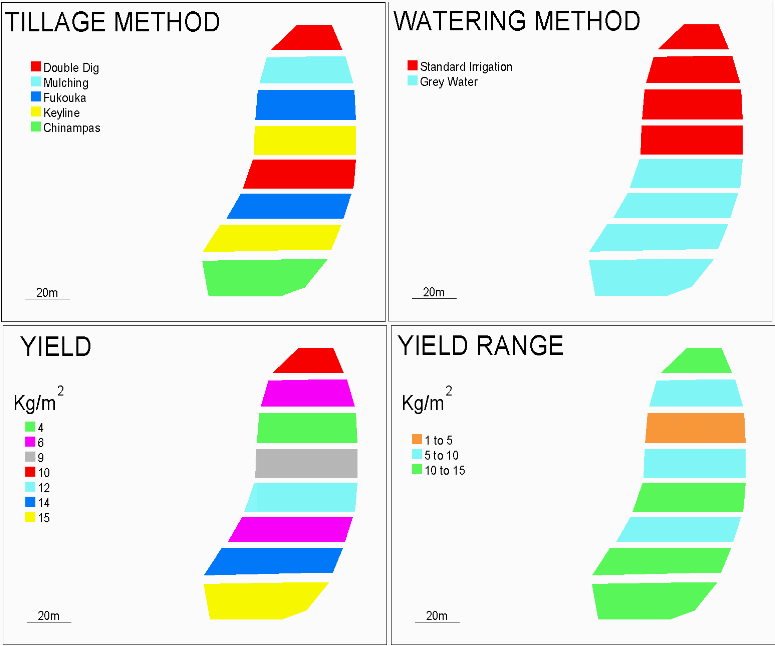
Fig 5
DISCUSSION
From this example it can be seen that for these site conditions, chinampas beds and keyline tillage followed by double digging with grey water gave the best results.
Neither Fukuoka, nor mulching is the best way to get carrots to grow well.
There is greater benefit in using grey water than other water for carrot production.
At the same time energy input can be computed and it may be that keyline is the best solution because less energy is used, even if chinampas gave the higher yield.
Even though these are elementary examples using fictitious data it does demonstrate the value of GIS to manage large volumes of diverse information and to extract meaningful information from it. The GIS can be used to record information about individual plants in a field at a micro level or whole farms at a macro level.
I believe that gathering all this information will start putting us in a position to build an Africa database. This information will be able to give us strong indicators for a given area on what to plant, or what variety, how to plant it, what pests may be involved and how to combat them. Hopefully it will also provide a monitoring system to pick up crop or soil deterioration before preventative or corrective action requires too great an energy input.
-ooOoo-