


COMPLETE ATLANTIC BASIN TROPICAL
CYCLONE COVERAGE

COMPLETE ATLANTIC BASIN TROPICAL
CYCLONE COVERAGE


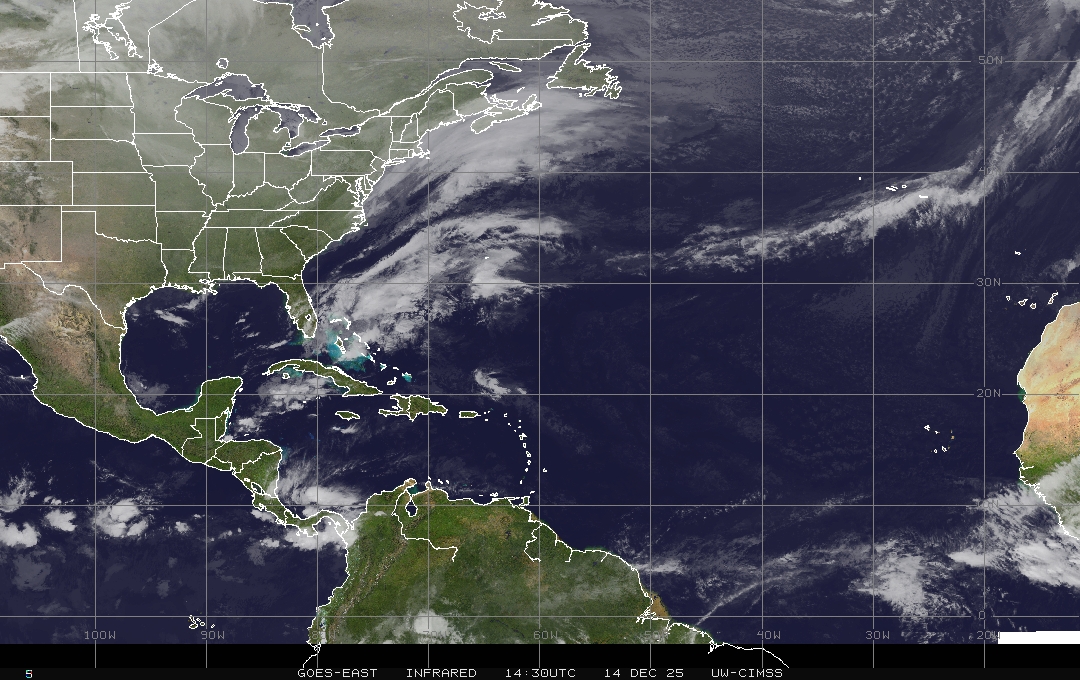
NWS AFD PR Lesser Antilles Radar St Croix, St Thomas, & Puerto Rico Radar

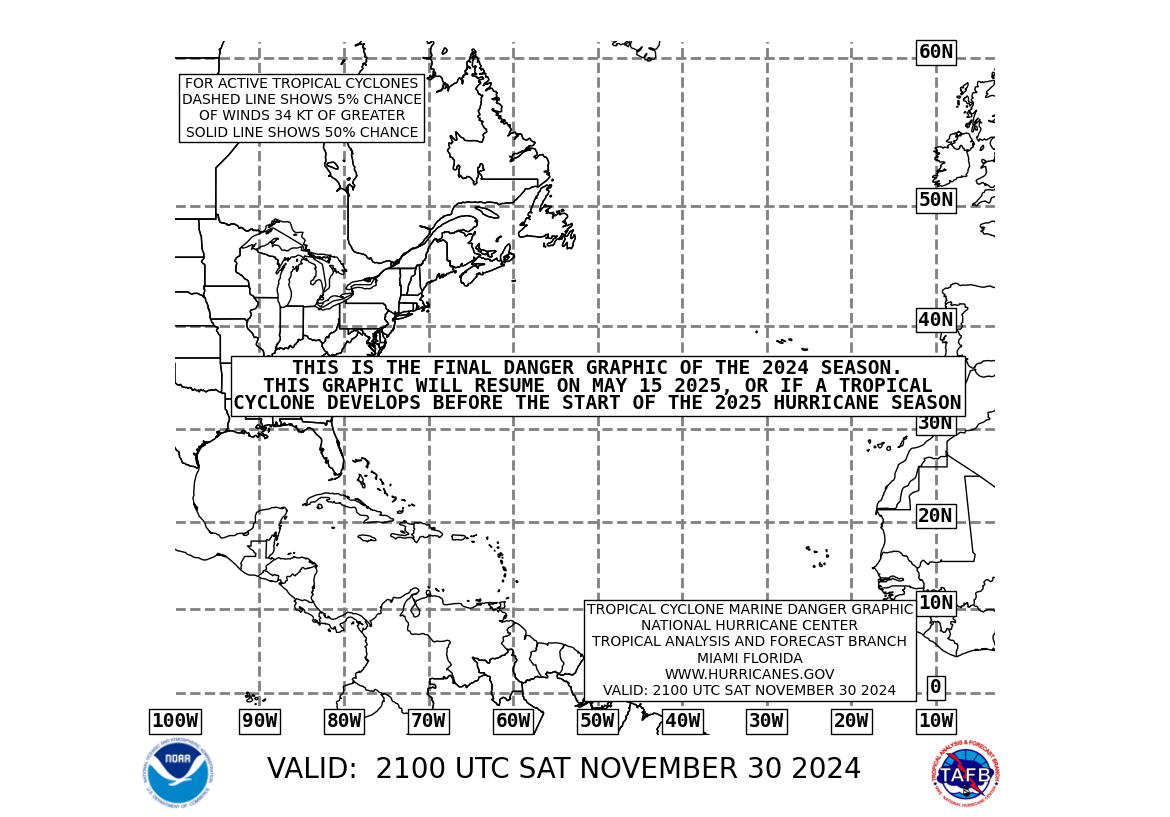
Graphical Tropical Weather Outlook Atlantic Tropical Cyclone Activity Tropical Cyclone Danger Area
NWS TPC/ NHC - High Seas Forecast Gulf of Mexico Offshore Waters Forecast
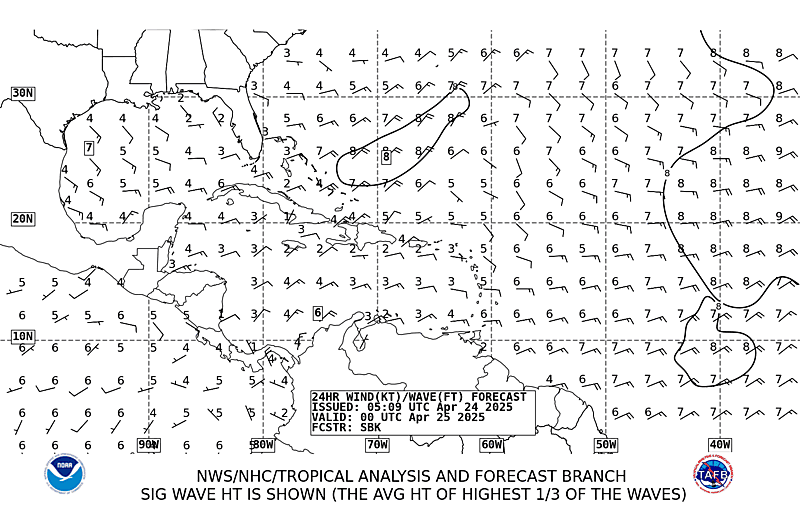
NWS/NCEP - Tropical Prediction Center/TAFB - Sig Wave HT & Direction National Data Buoy Center
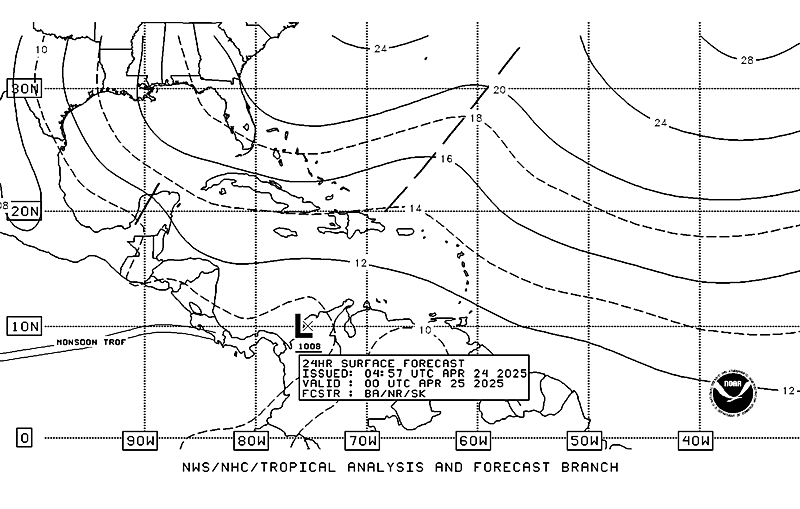
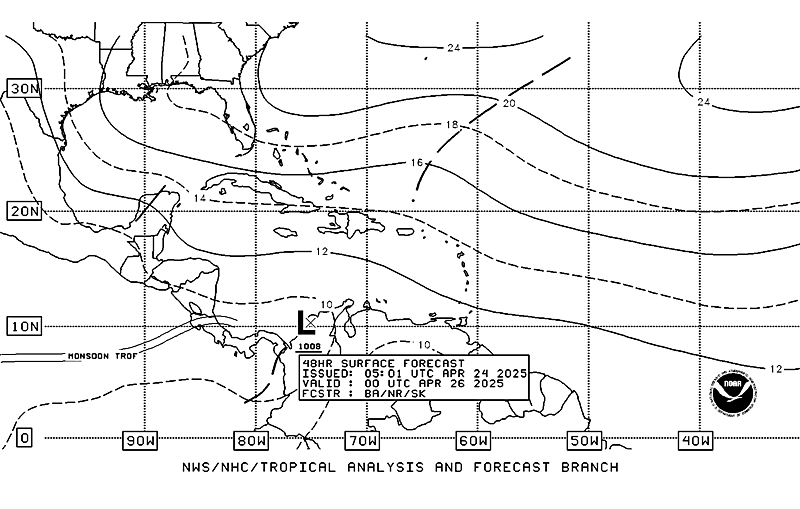
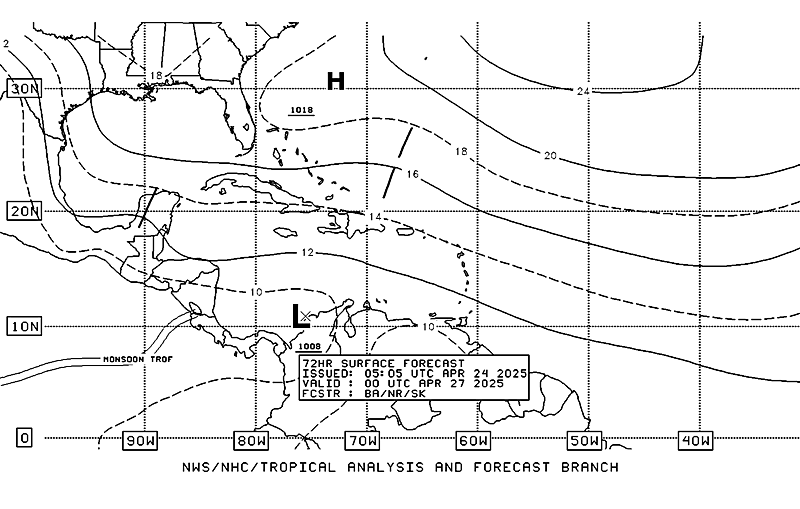
Surface Forecast Map, Hour 24 48 72 Tropical Cyclone Names Canadian Hurricane Centre
Saharan Air Layer Analysis Current Favorable Tropical Cyclone Genisis Areas Current Sea Surface Temps
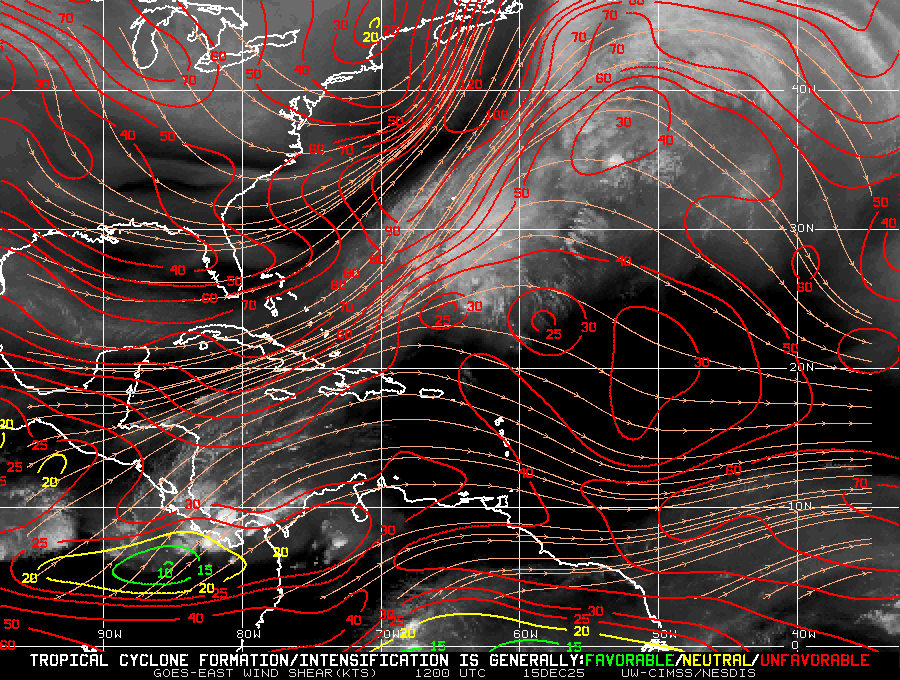
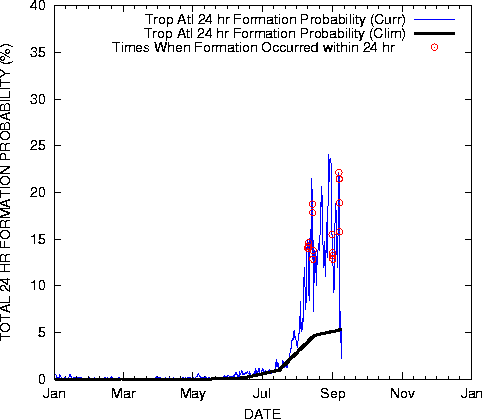
Wind Shear Probability of TC Formation within 24 Hours Tropical Cyclone Development Probability
Gulf 24 Hour Formation Probability Caribbean 24 Hour Development Probability
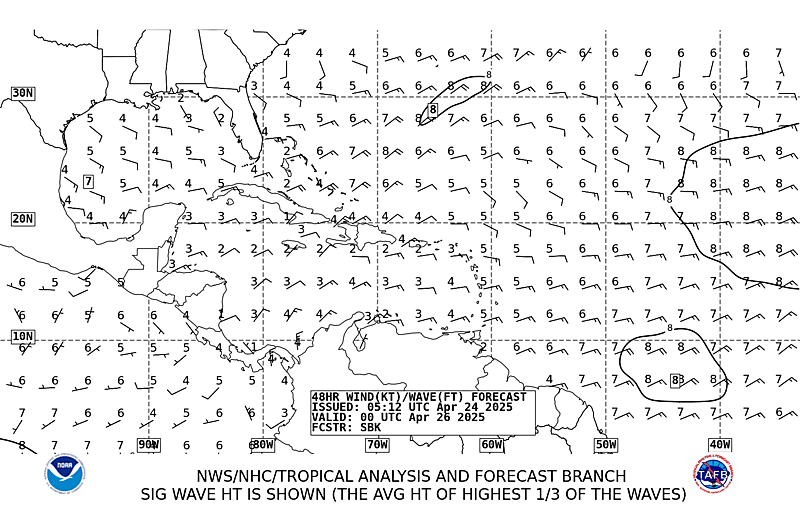
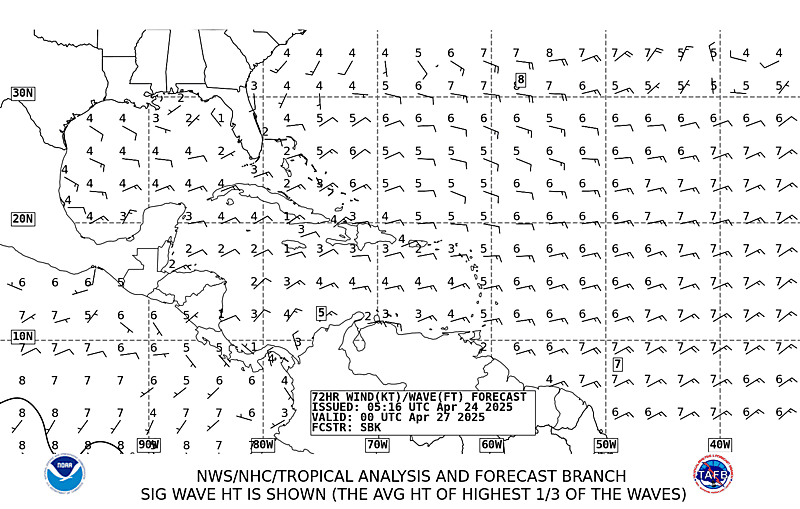
Wind / Wave Forecast, Hour 24 48 72 Saffir-Simpson Hurricane Scale Seasonal Activity Chart
DVORAK Current Intensity Chart
UTC, EDT, CDT Time Conversion
 Hurricane Preparedness