-
What is the largest source of revenue for Ohio?
a. corporate tax
b. income tax
c. sales tax
d. utility tax
-
Corporate and utility taxes make up ___ cents of every tax dollar.
a. 3
b. 6
c. 14
d. 37
-
Income tax and sales tax make up ___ cents of every tax dollar.
a. 20
b. 51
c. 54
d. 77
-
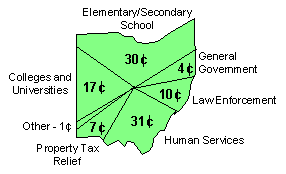
Law Enforcement receives ___ cents of every tax dollar.
a. 4
b. 7
c. 10
d. 17
-
The area which receives the most state money is
a. colleges
b. human services
c. elementary/secondary schools
d. property tax relief
-
Out of every tax dollar, 47 cents goes to
a. education
b. human services
c. general government
d. law enforcement
-
What is the largest source of income for the U.S. Government?
a. corporate taxes
b. excise, customs, estate gift and other miscellaneous taxes
c. personal income taxes
d. social security, Medicare, unemployment, and other retirement taxes
-
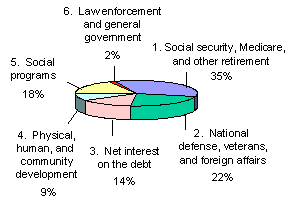
Borrowing to cover the deficit is ___% of federal income.
a. 3
b. 6
c. 14
d. 37
-
Personal income taxes and social security, Medicare unemployment and other
retirement taxes make up ___% of federal income.
a. 45
b. 51
c. 57
d. 68
-
Law Enforcement and general government receives ___% of federal income.
a. 2
b. 9
c. 14
d. 18
-
The area which receives the most federal money is
a. #1
b. #2
c. #3
d. #5
-
Social security, Medicare, and other retirement programs plus social programs
receive ___% of outlays.
a. 32
b. 40
c. 53
d. 57
|
|
|

|
The Companion to The Little Book On Line
for Teachers and Tutors |
T: Charts and Graphs
Learning Outcome #16: Demonstrate the ability to use information that enables citizens to make informed choices.
d. Draw conclusions by reading and interpreting data presented in charts and graphs.
Directions, Part A: Read Section T in Important Things to Remember in The Little Book. Then, answer the multiple choice questions below using the charts and graphs. Be careful when drawing conclusions from charts and graphs. Conclusions must be based on the data available and not your opinions.
Using Charts or Tables: Saturday AM Westbound Bus Schedule
1. The bus is departing at 10:36. At which station is the bus?
-
a. May-Rich
b. May-Green
c. May-Warren
d. Center Square
2. What is the earliest bus to depart from May-Green?
-
a. 7:16
b. 7:28
c. 7:32
d. 7:36
3. You live near the May-Rich bus station. To arrive at Center Square before 9:00, what time should your bus depart?
-
a. 8:13
b. 9:43
c. 10:28
d. 11:13
Using a Circle Graph or Pie Graph: Milton's Family Budget
4. What percent of Milton's family income was put into savings?
-
a. 6%
b. 15%
c. 21%
d. not enough information to say
5. Over 50% of Milton's family income paid for food and rent?
-
a. true
b. false
c. not enough information to say
6. Milton's family did not spend enough money on clothes.
-
a. true
b. false
c. not enough information to say
Using Bar Graphs: School Attendance and Science Grades
7. Which student had the poorest school attendance and lowest science grade?
-
a. Ben
b. Chuck
c. Dan
d. Earl
8. Whose attendance was under 50%?
-
a. Al
b. Ben
c. Dan
d. Fred
9. Which of the following students had a grade of less than 80%?
-
a. Al
b. Chuck
c. Dan
d. Fred
10. This bar graph shows that students with good school attendance have high science grades.
-
a. true
b. false
c. not enough information to say
Using Line Graphs: Howard Basketball Teams
11. How many games did the boys basketball team win in 1988?
-
a. 14
b. 15
c. 16
d. 18
12. In what year did the girls win 9 games?
-
a. 1988
b. 1990
c. 1991
d. 1993
13. In which year did the boys have their worst record and the girls have their best record?
-
a. 1988
b. 1989
c. 1991
d. 1993
14. This line graph shows that between 1988 and 1993
-
a. boys and girls basketball teams had winning seasons.
b. the boys teams were district champions.
c. the girls teams had terrible coaches.
d. the boys teams had more wins than the girls teams in every year except one.
![]()
Directions, Part B: The charts below are from the 1995 Ohio Income Tax Return Form IT-1040 and Instructions. Use those charts to answer the questions below.
Ohio's Tax Dollars: 1995
Where the Tax Dollar Comes From

|
Where the Tax Dollar Goes

|
![]()
Directions, Part C: The pie graphs below are from the 1995 1040 Forms and Instructions published
by the Internal Revenue Service. Use those charts to answer the questions below.
|
Income
|
Outlays

|
![]()
