Atmospheric Administration (NOAA), National Weather Service (NWS), and
United States Weather Weekly Weather Forecast By State, Location, County or City.
|
|
| | UNITED STATES SATELLITE IMAGES | UNITED STATES RADAR IMAGES | UNITED STATES & OTHER COUNTRIES LIGHTNING | |
 |
Current Threat Condition Risk of Terrorist Attacks |
|
|
|
|
Tropical Cyclones Worldwide - 24/365
|
Depressions, Tropical Storms, Hurricanes and Typhoons. |
DAILY |
See if any Tropical Cyclones in the Atlantic, Eastern Pacific, Central Pacific, Western Pacific, or Indian Ocean are of concern to you. |
See page bottom for disclaimers and use of data and products.
See page bottom for an explanation of Radar, and types of Radar images.
|
| NOTE |
If the USA map on this page appears
incorrect, it may be because you are using Dial-Up Acceleration. Reduce the Acceleration to normal, and "Refresh" or "Reload" the page. |
| You can "Point-and-Click" or Right Click on the Radar Site of your choice and select Open Link or Open Link in New Window. |
|
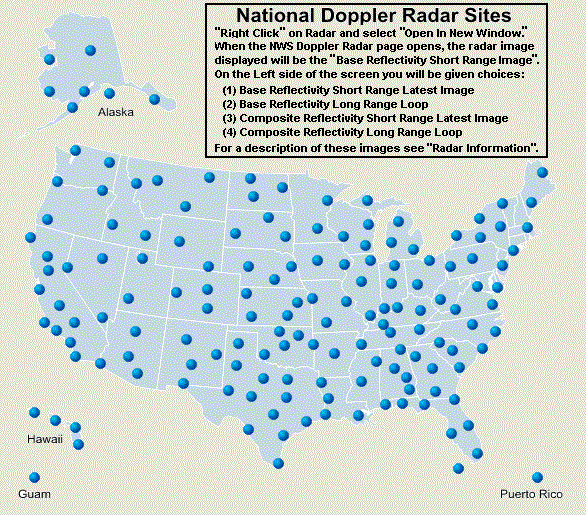 |
What is Radar? What do these images show?
Extracted from descriptions provided by the National Weather Service (NWS).
|
How does the radar work? NEXRAD (Next Generation Radar) obtains weather information
This reflected signal is then received by the radar during
its listening period. What are the different types of radar images? Base Reflectivity This is a display of echo intensity (reflectivity) measured
in dBZ (decibels of Z, The base reflectivity image currently available on this
website is from the lowest Composite Reflectivity This display is of maximum echo intensity (reflectivity)
from any elevation angle Although the Composite Reflectivity product is able to
display maximum echo How often are the images updated? Image updates are based upon the operation mode of the
radar at the time the Is everything I see on
the images Weather surveillance radars such as the WSR-88D can detect
most precipitation Echoes from surface targets appear in almost all radar
reflectivity images. In the Finally, aircraft often appear as "point targets"
far from the radar, particularly in |
|
Note from American Legion Post 119 Gulfport, Mississippi The paragraphs, following this note, describe Clutter.
|
|
Is everything I see on
the images Echoes from surface targets appear in almost all radar
reflectivity images. In the Finally, aircraft often appear as "point targets"
far from the radar, particularly in |
|
Use of Data and Products...from
NWS The user assumes the entire risk
related to its use of this data. NWS is providing this As required by 17 U.S.C. 403, third parties producing copyrighted
works |
|
Disclaimer from American
Legion Post 119 The U.S. Doppler Radar images provided here, may or may not be current and/or timely. They are provided for general information only. As always, when lives or property are at risk, the National and local State and City Emergency Managers instructions should be followed. |
| | SITE MAP | LEGION INTERNET DIRECTORIES | POST LOCATION DIRECTORIES | TROPICAL STORMS WORLDWIDE | |
|
CREATED AND MAINTAINED BY
AMERICAN LEGION POST 119 GULFPORT MISSISSIPPI AS A SERVICE TO THE AMERICAN LEGION COMMUNITY AND ALL VETERANS ORGANIZATIONS |
|