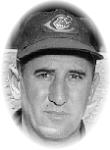
Connie Mack Full Name: Cornelius Alexander "The Tactician" Mack Height: 6'1" Weight: 150 lbs. Born: December 22, 1862 in East Brookfield, MA Died: February 8, 1956 in Phildelphia, PA Major League Career: 1886 to 1896 Managerial Debut: 1894 |
MANAGER |
Year | TM/L | G | W | L | PCT | M/Y | W-EXP | A-E | Standing |
1894 | PIT-N | 23 | 12 | 10 | 0.545 | 2-2 | 10.8 | 1.2 | 7 |
1895 | PIT-N | 135 | 71 | 61 | 0.538 | 68.1 | 2.9 | 7 | |
1896 | PIT-N | 131 | 66 | 63 | 0.512 | 68.5 | -2.5 | 6 | |
1901 | PHI-A | 137 | 74 | 62 | 0.544 | 71.9 | 2.1 | 4 | |
1902 | PHI-A | 137 | 83 | 53 | 0.610 | 81.0 | 2.0 | 1 AL Champ - No WS | |
1903 | PHI-A | 137 | 75 | 60 | 0.556 | 75.7 | -0.7 | 2 | |
1904 | PHI-A | 155 | 81 | 70 | 0.536 | 81.7 | -0.7 | 5 | |
1905 | PHI-A | 152 | 92 | 56 | 0.622 | 88.5 | 3.5 | 1 Lost WS 1-4 NY Giants | |
1906 | PHI-A | 149 | 78 | 67 | 0.538 | 74.5 | 3.5 | 4 | |
1907 | PHI-A | 150 | 88 | 57 | 0.607 | 80.4 | 7.6 | 2 | |
1908 | PHI-A | 157 | 68 | 85 | 0.444 | 67.7 | 0.3 | 6 | |
1909 | PHI-A | 153 | 95 | 58 | 0.621 | 99.5 | -4.5 | 2 | |
1910 | PHI-A | 155 | 102 | 48 | 0.680 | 101.0 | 1.0 | 1 WS Winner 4-1 vs CHI-N | |
1911 | PHI-A | 152 | 101 | 50 | 0.669 | 100.7 | 0.3 | 1 WS Winner 4-2 NY Giants | |
1912 | PHI-A | 153 | 90 | 62 | 0.592 | 87.8 | 2.2 | 3 | |
1913 | PHI-A | 153 | 96 | 57 | 0.627 | 96.6 | -0.6 | 1 WS Winner 4-1 NY Giants | |
1914 | PHI-A | 158 | 99 | 53 | 0.651 | 99.2 | -0.2 | 1 Lost WS 0-4 BOS-N | |
1915 | PHI-A | 154 | 43 | 109 | 0.283 | 42.3 | 0.7 | 8 | |
1916 | PHI-A | 154 | 36 | 117 | 0.235 | 41.5 | -5.5 | 8 | |
1917 | PHI-A | 154 | 55 | 98 | 0.359 | 59.2 | -4.2 | 8 | |
1918 | PHI-A | 130 | 52 | 76 | 0.406 | 50.0 | 2.0 | 8 | |
1919 | PHI-A | 140 | 36 | 104 | 0.257 | 40.8 | -4.8 | 8 | |
1920 | PHI-A | 156 | 48 | 106 | 0.312 | 49.3 | -1.3 | 8 | |
1921 | PHI-A | 155 | 53 | 100 | 0.346 | 54.0 | -1.0 | 8 | |
1922 | PHI-A | 155 | 65 | 89 | 0.422 | 65.1 | -0.1 | 7 | |
1923 | PHI-A | 153 | 69 | 83 | 0.454 | 66.2 | 2.8 | 6 | |
1924 | PHI-A | 152 | 71 | 81 | 0.467 | 67.0 | 4.0 | 5 | |
1925 | PHI-A | 153 | 88 | 64 | 0.579 | 87.1 | 0.9 | 2 | |
1926 | PHI-A | 150 | 83 | 67 | 0.553 | 86.1 | -3.1 | 3 | |
1927 | PHI-A | 155 | 91 | 63 | 0.591 | 87.9 | 3.1 | 2 | |
1928 | PHI-A | 153 | 98 | 55 | 0.641 | 97.4 | 0.6 | 2 | |
1929 | PHI-A | 151 | 104 | 46 | 0.693 | 102.1 | 1.9 | 1 WS Winner 4-1 vs CHI-N | |
1930 | PHI-A | 154 | 102 | 52 | 0.662 | 95.0 | 7.0 | 1 WS Winner 4-2 vs STL-N | |
1931 | PHI-A | 153 | 107 | 45 | 0.704 | 98.4 | 8.6 | 1 Lost WS 3-4 vs STL-N | |
1932 | PHI-A | 154 | 94 | 60 | 0.610 | 97.5 | -3.5 | 2 | |
1933 | PHI-A | 152 | 79 | 72 | 0.523 | 77.5 | 1.5 | 3 | |
1934 | PHI-A | 153 | 68 | 82 | 0.453 | 68.1 | -0.1 | 5 | |
1935 | PHI-A | 149 | 58 | 91 | 0.389 | 59.8 | -1.8 | 8 | |
1936 | PHI-A | 154 | 53 | 100 | 0.346 | 47.1 | 5.9 | 8 | |
1937 | PHI-A | 120 | 39 | 80 | 0.328 | 1-2 | 48.0 | -9.0 | 7 |
1938 | PHI-A | 154 | 53 | 99 | 0.349 | 55.1 | -2.1 | 8 | |
1939 | PHI-A | 62 | 25 | 37 | 0.403 | 1-2 | 19.7 | 5.3 | 7 |
1940 | PHI-A | 154 | 54 | 100 | 0.351 | 55.9 | -1.9 | 8 | |
1941 | PHI-A | 154 | 64 | 90 | 0.416 | 65.0 | -1.0 | 8 | |
1942 | PHI-A | 154 | 55 | 99 | 0.357 | 51.5 | 3.5 | 8 | |
1943 | PHI-A | 155 | 49 | 105 | 0.318 | 53.4 | -4.4 | 8 | |
1944 | PHI-A | 155 | 72 | 82 | 0.468 | 69.3 | 2.7 | 5 | |
1945 | PHI-A | 153 | 52 | 98 | 0.347 | 59.1 | -7.1 | 8 | |
1946 | PHI-A | 155 | 49 | 105 | 0.318 | 60.8 | -11.8 | 8 | |
1947 | PHI-A | 156 | 78 | 76 | 0.506 | 79.0 | -1.0 | 5 | |
1948 | PHI-A | 154 | 84 | 70 | 0.545 | 76.4 | 7.6 | 4 | |
1949 | PHI-A | 154 | 81 | 73 | 0.526 | 77.1 | 3.9 | 5 | |
1950 | PHI-A | 154 | 52 | 102 | 0.338 | 54.3 | -2.3 | 8 | |
Totals | 53 | 7755 | 3731 | 3948 | 0.486 | 3717.6 | 13.4 |
TM/L G W L PCT M/Y W-EXP A-E Standing |
Team and League Games managed (including ties) Wins Losses Percentage of games won Manager/Year (The latter number indicates how many managers the team employed that year, while the former indicates the chronological position of the manager [i.e. 1-2 would mean this manager was the first of two managers during that year]). Expected Wins. Calculated for the team based on its actual runs scored and allowed. A team that allows exactly as many runs as it scores is predicted to play .500 ball. Actual Wins Minus Expected Wins (A measure of the extent to which a team outperformed (or underperformed) its talent. (Over time this reflects good/bad managing). Team's final standing for the season or, in the case of multiple managers, the standings at the time the manager departed. |