|


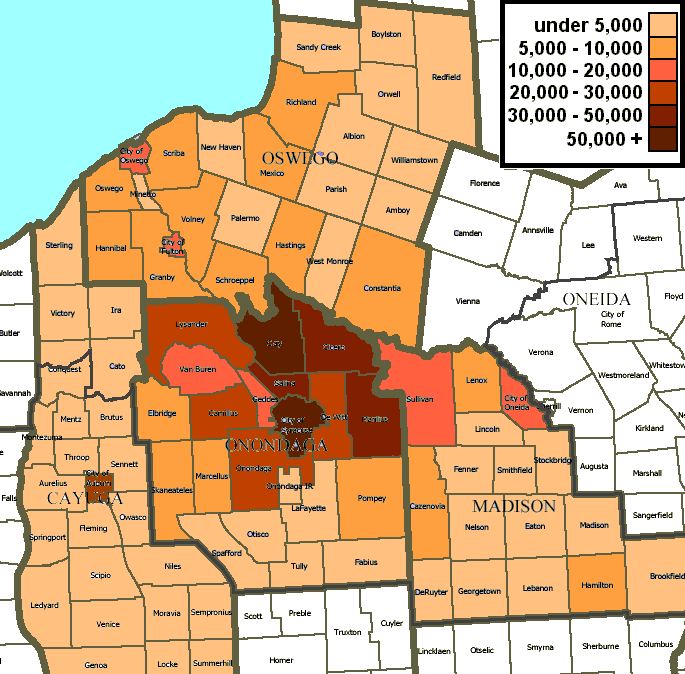
2004 Population by Town

2000 Census
Rank Metro Percent Living in State of Birth
1. Johnstown, PA 89.81%
2. Altoona,
PA 89.69%
3. Houma, LA 89.05%
4. Lafayette, LA 86.60%
5. Williamsport, PA 86.39%
6. Scranton--Wilkes-Barre--Hazleton,
PA 85.29%
7. Pittsburgh, PA 84.34%
8. Saginaw--Bay City--Midland, MI 83.68%
9. Utica--Rome, NY 83.44%
10. St.
Cloud, MN 83.36%
11. Lima, OH 82.98%
12. Victoria, TX 82.67%
13. Buffalo--Niagara Falls, NY 82.49%
14. Gadsden,
AL 82.08%
15. Syracuse, NY 81.52%
16. Sharon, PA 81.35%
17. Appleton--Oshkosh--Neenah, WI 81.19%
18.
Erie, PA 81.13%
19. Canton--Massillon, OH 81.11%
20. Charleston, WV 81.08%
21. Jackson, MI 80.67%
22. Alexandria,
LA 80.61%
23. Springfield, IL 80.54%
24. Wausau, WI 80.51%
25. Rocky Mount, NC 80.41%
26. Sheboygan, WI 80.16%
27.
Danville, VA 80.02%
28. Monroe, LA 79.72%
29. Albany--Schenectady--Troy, NY 79.67%
30. Reading, PA 79.64%
31.
Dubuque, IA 79.58%
32. Glens Falls, NY 79.49%
33. Owensboro, KY 79.28%
34. Bismarck, ND 79.27%
35. Jackson, MS
79.25%
36. Pine Bluff, AR 79.17%
37. Lancaster, PA 79.07%
38. Flint, MI 78.86%
39. Mansfield, OH 78.75%
40.
Harrisburg--Lebanon--Carlisle, PA 78.75%
41. Peoria--Pekin, IL 78.57%
42. Kankakee, IL 78.56%
43. Lake Charles, LA
78.53%
44. Decatur, IL 78.51%
45. Green Bay, WI 78.20%
46. Rochester, NY 77.93%
47. Baton Rouge, LA 77.75%
48.
Toledo, OH 77.48%
49. Grand Rapids--Muskegon--Holland, MI 77.42%
50. Waterloo--Cedar Falls, IA 77.39%
51. Lubbock,
TX 77.32%
52. Nassau--Suffolk, NY 77.02%
53. Lansing--East Lansing, MI 77.00%
54. Florence, SC 76.96%
55. New
Orleans, LA 76.68%
56. Birmingham, AL 76.68%
57. Lewiston--Auburn, ME 76.33%
58. Tuscaloosa, AL 76.25%
59. Jamestown,
NY 76.23%
60. St. Joseph, MO 76.18%
61. Florence, AL 76.17%
62. Eau Claire, WI 75.88%
63. Youngstown--Warren,
OH 75.64%
64. Akron, OH 75.54%
65. Kokomo, IN 75.38%
66. Decatur, AL 75.30%
67. Elmira, NY 75.24%
68. Bangor,
ME 75.17%
69. Albany, GA 75.14%
70. Terre Haute, IN 75.05%
71. Cedar Rapids, IA 75.03%
72. Bloomington--Normal,
IL 75.00%
73. Waco, TX 74.99%
74. Muncie, IN 74.96%
75. Corpus Christi, TX 74.52%
76. Anniston, AL 74.36%
77.
Hattiesburg, MS 73.90%
78. Binghamton, NY 73.80%
79. Cleveland--Lorain--Elyria, OH 73.59%
80. Duluth--Superior, MN--WI
73.57%
81. Hickory--Morganton--Lenoir, NC 73.57%
82. Kalamazoo--Battle Creek, MI 73.10%
83. Racine, WI 73.10%
84.
Detroit, MI 73.05%
85. York, PA 72.96%
86. Milwaukee--Waukesha, WI 72.71%
87. Jackson, TN 72.58%
88. Lynchburg,
VA 72.45%
89. Des Moines, IA 72.38%
90. Beaumont--Port Arthur, TX 72.25%
91. Fort Wayne, IN 72.14%
92. Evansville--Henderson,
IN--KY 71.97%
93. Tyler, TX 71.84%
94. State College, PA 71.82%
95. Montgomery, AL 71.51%
96. Greenville, NC 71.50%
97.
Allentown--Bethlehem--Easton, PA 71.43%
98. Dutchess County, NY 71.38%
99. San Angelo, TX 71.20%
100. Janesville--Beloit,
WI 71.17%
101. Shreveport--Bossier City, LA 71.05%
102. Columbus, OH 70.79%
103. Dayton--Springfield, OH 70.78%
104.
Odessa--Midland, TX 70.73%
105. St. Louis, MO--IL 70.36%
106. Longview--Marshall, TX 70.19%
107. Parkersburg--Marietta,
WV--OH 70.08%
108. Jonesboro, AR 69.95%
109. Topeka, KS 69.71%
110. Indianapolis, IN 69.50%
111. Mobile, AL 69.35%
112.
Macon, GA 69.32%
113. Louisville, KY--IN 69.25%
114. Pittsfield, MA 69.24%
115. Cincinnati, OH--KY--IN 69.07%
116.
Lexington, KY 68.63%
117. Wheeling, WV--OH 68.54%
118. Roanoke, VA 68.49%
119. Brazoria, TX 68.36%
120. La Crosse,
WI--MN 68.28%
121. Abilene, TX 68.03%
122. Goldsboro, NC 67.94%
123. Hamilton--Middletown, OH 67.93%
124. Hagerstown,
MD 67.81%
125. Lincoln, NE 67.72%
126. Bryan--College Station, TX 67.67%
127. Rockford, IL 67.62%
128. Ann Arbor,
MI 67.56%
129. Huntington--Ashland, WV--KY--OH 67.45%
130. Champaign--Urbana, IL 67.44%
131. Vineland--Millville--Bridgeton,
NJ 67.40%
132. Philadelphia, PA--NJ 67.29%
133. Little Rock--North Little Rock, AR 67.23%
134. Sherman--Denison,
TX 66.82%
135. Amarillo, TX 66.68%
136. Greensboro--Winston-Salem--High Point, NC 66.57%
137. Springfield, MA 66.34%
138.
Pueblo, CO 66.29%
139. Sumter, SC 66.26%
140. Greenville--Spartanburg--Anderson, SC 66.00%
141. Minneapolis--St.
Paul, MN--WI 65.90%
142. Davenport--Moline--Rock Island, IA--IL 65.90%
143. San Antonio, TX 65.89%
144. Redding,
CA 65.70%
145. Lafayette, IN 65.68%
146. Knoxville, TN 65.66%
147. Madison, WI 65.61%
148. South Bend, IN 65.33%
149.
Galveston--Texas City, TX 65.26%
150. Newburgh, NY--PA 65.00%
151. Barnstable--Yarmouth, MA 65.00%
152. Enid, OK
64.80%
153. Chico--Paradise, CA 64.80%
154. Dothan, AL 64.68%
155. Laredo, TX 64.57%
156. Elkhart--Goshen, IN
64.47%
157. Steubenville--Weirton, OH--WV 63.85%
158. Johnson City--Kingsport--Bristol, TN--VA 63.79%
159. Baltimore,
MD 63.47%
160. Providence--Warwick--Pawtucket, RI 63.32%
161. Sioux Falls, SD 63.28%
162. Chicago, IL 63.21%
163.
Richmond--Petersburg, VA 63.16%
164. Savannah, GA 63.13%
165. Wichita, KS 62.83%
166. Modesto, CA 62.66%
167.
Bloomington, IN 62.65%
168. Portland, ME 62.63%
169. Boston--Worcester--Lawrence--Lowell--Brockton, MA--NH 62.61%
170.
Iowa City, IA 62.55%
171. Cumberland, MD--WV 62.50%
172. Columbia, MO 62.49%
173. Salt Lake City--Ogden, UT 62.36%
174.
San Luis Obispo--Atascadero--Paso Robles, CA 62.25%
175. Springfield, MO 62.21%
176. Oklahoma City, OK 62.02%
177.
Columbia, SC 61.83%
178. Athens, GA 61.67%
179. Fresno, CA 61.42%
180. Asheville, NC 61.41%
181. Provo--Orem,
UT 61.36%
182. Brownsville--Harlingen--San Benito, TX 61.30%
183. Gary, IN 60.91%
184. Visalia--Tulare--Porterville,
CA 60.83%
185. Stockton--Lodi, CA 60.80%
186. Rochester, MN 60.73%
187. Pocatello, ID 60.69%
188. Sioux City,
IA--NE 60.52%
189. Tulsa, OK 60.46%
190. Monmouth--Ocean, NJ 60.43%
191. Joplin, MO 60.20%
192. Wichita Falls,
TX 60.17%
193. Santa Rosa, CA 60.06%
194. Bakersfield, CA 60.02%
195. Nashville, TN 59.50%
196. Grand Forks, ND--MN
59.34%
197. Hartford, CT 59.08%
198. Omaha, NE--IA 58.90%
199. Fort Worth--Arlington, TX 58.79%
200. Huntsville,
AL 58.68%
201. Austin--San Marcos, TX 58.60%
202. Sacramento, CA 58.51%
203. Memphis, TN--AR--MS 58.47%
204. McAllen--Edinburg--Mission,
TX 58.12%
205. Billings, MT 58.04%
206. Fort Smith, AR--OK 57.97%
207. Auburn--Opelika, AL 57.96%
208. Merced,
CA 57.92%
209. Benton Harbor, MI 57.80%
210. Chattanooga, TN--GA 57.58%
211. Rapid City, SD 57.43%
212. Yolo,
CA 57.19%
213. Yuba City, CA 57.11%
214. Burlington, VT 56.92%
215. Santa Cruz--Watsonville, CA 56.82%
216. Trenton,
NJ 56.82%
217. Charleston--North Charleston, SC 56.67%
218. Fargo--Moorhead, ND--MN 56.47%
219. Great Falls, MT 56.26%
220.
Charlotte--Gastonia--Rock Hill, NC--SC 56.24%
221. Tallahassee, FL 55.96%
222. Riverside--San Bernardino, CA 55.92%
223.
Wilmington, NC 55.86%
224. Newark, NJ 55.85%
225. Honolulu, HI 55.80%
226. Texarkana, TX--Texarkana, AR 55.75%
227.
Houston, TX 55.71%
228. Yakima, WA 55.49%
229. Kenosha, WI 55.24%
230. Dallas, TX 54.98%
231. New Haven--Bridgeport--Stamford--Waterbury--Danbury,
CT 54.80%
232. Biloxi--Gulfport--Pascagoula, MS 54.77%
233. Vallejo--Fairfield--Napa, CA 54.07%
234. Augusta--Aiken,
GA--SC 53.91%
235. Atlantic--Cape May, NJ 53.79%
236. New London--Norwich, CT 53.78%
237. El Paso, TX 53.72%
238.
Kansas City, MO--KS 53.71%
239. Charlottesville, VA 53.69%
240. Lawrence, KS 53.01%
241. Ventura, CA 52.84%
242.
Spokane, WA 52.59%
243. Raleigh--Durham--Chapel Hill, NC 52.33%
244. Middlesex--Somerset--Hunterdon, NJ 52.24%
245.
Greeley, CO 52.05%
246. New York, NY 51.70%
247. Bellingham, WA 51.69%
248. Santa Barbara--Santa Maria--Lompoc, CA
51.16%
249. Oakland, CA 51.08%
250. Columbus, GA--AL 51.03%
251. Albuquerque, NM 50.14%
252. Flagstaff, AZ--UT
50.00%
253. Missoula, MT 49.79%
254. Salinas, CA 49.59%
255. Dover, DE 49.27%
256. Grand Junction, CO 49.09%
257.
Tacoma, WA 48.74%
258. Wilmington--Newark, DE--MD 48.48%
259. Salem, OR 48.15%
260. Bergen--Passaic, NJ 48.07%
261.
Norfolk--Virginia Beach--Newport News, VA--NC 48.07%
262. Gainesville, FL 48.06%
263. Atlanta, GA 47.98%
264. Olympia,
WA 47.61%
265. Casper, WY 47.24%
266. Santa Fe, NM 46.81%
267. Richland--Kennewick--Pasco, WA 46.71%
268. Orange
County, CA 46.48%
269. Jacksonville, FL 46.13%
270. Killeen--Temple, TX 45.89%
271. Myrtle Beach, SC 45.36%
272.
Los Angeles--Long Beach, CA 45.20%
273. Fayetteville--Springdale--Rogers, AR 45.18%
274. Seattle--Bellevue--Everett,
WA 45.14%
275. Boise City, ID 45.12%
276. Eugene--Springfield, OR 45.10%
277. Fayetteville, NC 44.95%
278. San
Diego, CA 43.93%
279. San Jose, CA 43.81%
280. Lakeland--Winter Haven, FL 43.30%
281. Portland--Vancouver, OR--WA
43.29%
282. Clarksville--Hopkinsville, TN--KY 42.92%
283. Lawton, OK 42.69%
284. Corvallis, OR 42.44%
285. Pensacola,
FL 42.15%
286. San Francisco, CA 41.65%
287. Bremerton, WA 41.38%
288. Panama City, FL 41.21%
289. Denver, CO
41.17%
290. Jersey City, NJ 40.70%
291. Las Cruces, NM 40.13%
292. Fort Collins--Loveland, CO 38.14%
293. Medford--Ashland,
OR 37.21%
294. Jacksonville, NC 36.48%
295. Tucson, AZ 36.15%
296. Cheyenne, WY 35.43%
297. Ocala, FL 34.97%
298.
Phoenix--Mesa, AZ 32.72%
299. Anchorage, AK 32.09%
300. Tampa--St. Petersburg--Clearwater, FL 31.72%
301. Orlando,
FL 31.26%
302. Yuma, AZ 30.93%
303. Boulder--Longmont, CO 30.76%
304. Washington, DC--MD--VA--WV 30.51%
305. Miami,
FL 29.56%
306. Colorado Springs, CO 29.29%
307. Fort Walton Beach, FL 28.50%
308. Daytona Beach, FL 28.38%
309.
Melbourne--Titusville--Palm Bay, FL 28.08%
310. Fort Lauderdale, FL 27.93%
311. Fort Pierce--Port St. Lucie, FL 27.88%
312.
Reno, NV 26.61%
313. West Palm Beach--Boca Raton, FL 25.78%
314. Sarasota--Bradenton, FL 23.26%
315. Fort Myers--Cape
Coral, FL 22.66%
316. Naples, FL 19.40%
317. Las Vegas, NV--AZ 18.89%
318. Punta Gorda, FL 15.97%
|

