-
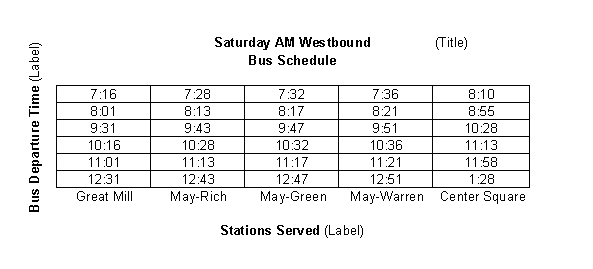
When is the time of the last bus leaving May-Green that will get you to Center
Square by 9:00 a.m.?
-
A. 8:01 a.m.
B. 8:17 a.m.
C. 7:16 a.m.
D. 8:21 a.m. -
How many minutes does it take the bus to get from May-Rich to May-Warren?
-
A. 6 minutes
B. 8 minutes
C. 20 minutes
D. 4 minutes -
There are six rows and five columns of information in this schedule. How many
cells of information are in the table?
-
A. 2
B. 5
C. 6
D. 30 -
What time does the bus leave Great Mill that gets to Center Square at 10:28
a.m.?
-
A. 9:31 a.m.
B. 9:43 a.m.
C. 8:55 a.m.
D. 8:01 a.m. -
If you want to know at what time the 9:31 a.m. Great Mill bus will arrive at
your stop May-Warren you can just look at
-
A. column four
B. row four, column three
C. column three
D. row three, column four
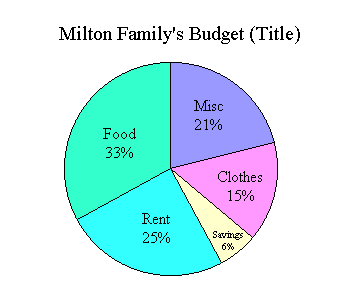
CIRCLE GRAPH - MILTON FAMILY BUDGET

Use the circle graph above to answer questions 6-8.
-
Which of the following statements is FALSE?
-
A. The family spends less on clothes than food.
B. The family spends more on rent than clothes and savings.
C. The family spends 100% of their income and saves nothing.
D. The family spends more than 50% of their income on food and rent. -
What conclusion can be drawn from the Milton Family Budget circle graph?
-
A. The most money is spent on rent.
B. As income increases the amount of money saved will stay constant.
C. $3,300 a year will feed the Milton family.
D. If the family income decreases, less money will be saved. -
If the Milton family moved in with another family and only had to spend half as
much of their income on rent, they would pay what %?
-
A. 25%
B. 50%
C. 12.5%
D. 0%
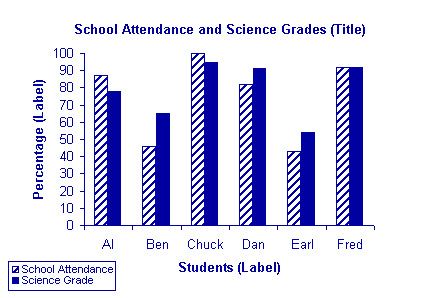
BAR GRAPH - SCHOOL ATTENDANCE AND SCIENCE GRADES

Use the bar graph above to answer questions 9-14.
-
If a science grade below 55% is failing, how many students failed science?
-
A. 1
B. 0
C. 2
D. 4 -
The bar graph shows the correlation of school attendance and the student's
science grade. Study the bar graph to see which statement is FALSE.
-
A. Ben and Earl's attendance at school and their grades are poor.
B. Three students had higher grade percentages than the percentage of school attendance.
C. If Ben and Earl had worked together they could have gotten 100% in science.
D. The higher percentage of grades, the higher the percentage of attendance. -
The student with the best grade and attendance was
-
A. Al
B. Chuck
C. Dan
D. Fred -
The student with the same school attendance and grade percentage was
-
A. Fred
B. Dan
C. Chuck
D. Ben -
Ben was what number in order from the student with the top grade to the lowest
grade of the six listed?
-
A. 2
B. 3
C. 6
D. 5 -
Which statement of the following is true?
-
A. Ben and Earl will not be promoted to the next grade.
B. School attendance affects the science grade.
C. Dan and Al attended school about the same number of days.
D. Chuck would get a better grade if he did not attend school so regularly.
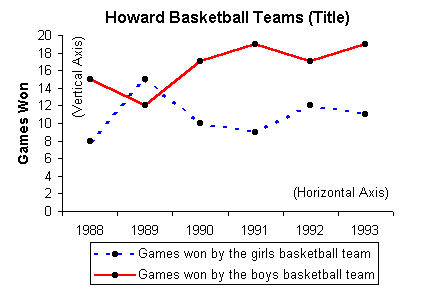
LINE GRAPH - HOWARD BASKETBALL TEAMS 
-
Looking at the line graph, in which year did the boys win twice as many games
as the girls?
-
A. 1993
B. 1990
C. 1988
D. 1991 -
In what year did the girls win more games than the boys?
-
A. 1989
B. 1990
C. 1991
D. 1992 -
Which statement of the following is true?
-
A. There are more boys than girls out for basketball.
B. In each year that the boys won fewer games than the previous year, the girls won more games than the previous year.
C. The boys increased the number of games won each year from 1989-1993.
D. Overall the girls tend to win more basketball games.
|
|
|

|
The Companion to The Little Book On Line
for Teachers and Tutors |
Vocabulary Drill
T. Charts, Tables and Graphs
16d. Draw conclusions by reading and interpreting data presented in charts and
graphs.
Ohio Department of Education - High School Proficiency Testing Fact Sheets
In answering these questions refer to Section T of The Little Book. Circle the letter of the correct answer.

-
Use the table above to answer questions 1-5.
![]()