Connecticut Demographics
Connecticut:
The Constitution State Atlas ![]()
Connecticut
Demographics ![]()
Projected Population Pyramids for 2000, 2010, and 2020
Population projections are derived from the formula: P1 = P0 + (B - D) + M. P1 is the estimate date, P0 is the current census, B is the expected number of births to occur in the estimate date, D is the expected number of deaths to occur in the estimate date, and M is the net migration. These variables consider the number of women of childbearing age (14-49), the rate women will bear children, social trends, survival rates with life expectancy assumed to increase approximately four years (75.9 - 79.1 years of age) over the next 30 years. (Campbell, 1996)
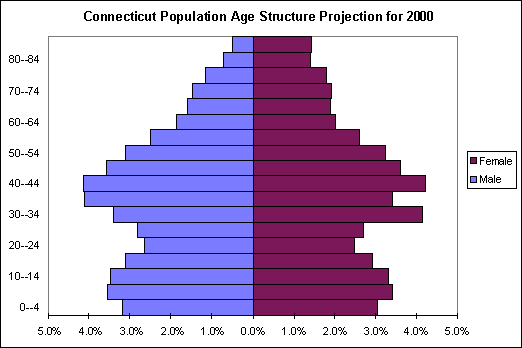
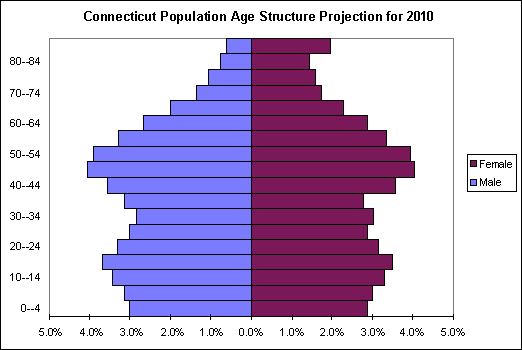
The year 2000 population pyramid is similar to 1990's. The baby boom bulge has risen 10 years peaking at the 40 - 44 age group, and the slight adolescent bulge beginning in the late eighties is present. The second bulge begins tapering off in the year 2010 and is almost entirely unnoticeable by 2020.
Beginning in 2010 the population pyramid begins forming into a column. The column becomes very evident in the year 2020. As a well formed pyramid illustrates a growing population, births exceeding deaths, and an inverted pyramid represents a shrinking population, the column portrays a ZPG (Zero Population Growth). In the column, the newborn population replaces the dying population with no net gain or loss. Many environmentalists are calling for governments to adopt the ZPG strategy, or SPG (Slow Population Growth) reduce the number of births until the population begins shrinking. It has recently been recognized that higher population numbers have a greater impact on the environment, and strategies to curb this growth are necessary for a sustainable planet.


Source:
Connecticut State Data Center. 1995